In the company world, spreadsheets are everywhere and used – at different degrees – by everyone. In my experience as an analyst, I have been able to study why most of the people have trouble extracting meaningful information, and it’s all about a lack of clean-up and organization of their datasets.
There are dos and don’ts when it comes to prepare your data for further analyses and Ia m going to reveal them to you.
Don’ts
Here are a few examples that – please – you should never apply!
Too beautiful for analyses
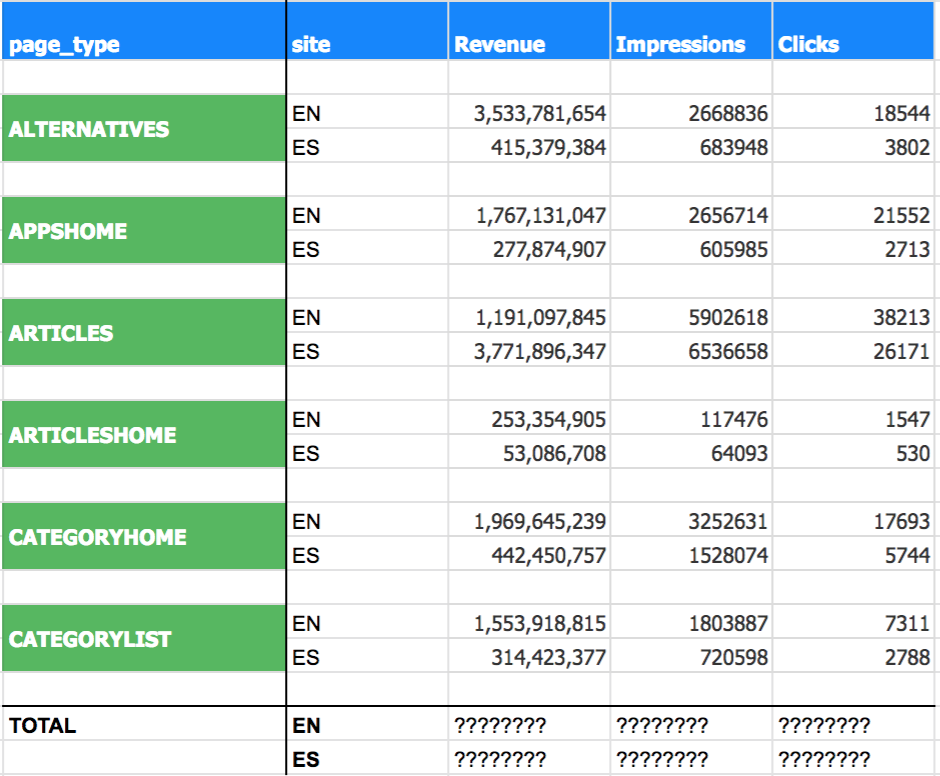
The original data is already organized for visualization, but that organization makes further manipulations complicated:
For example, how do I retrieve totals for EN and ES in an easy way?
Tabs, tabs, tabs, …
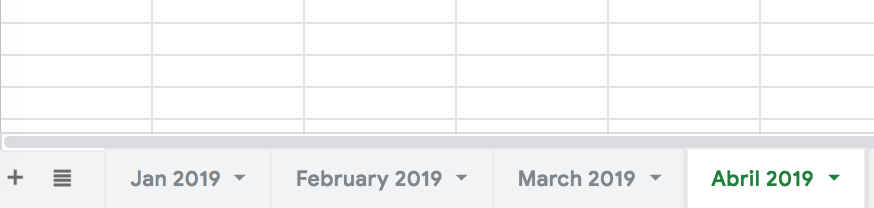
Multiplying tabs for content that have similar properties complicates drastically cross-overs between the different datasets.
In this example, how do I make a chart of a monthly trend?
Different dimensions in a single column

The location, the type of pages and the categories are 3 different dimensions. Hence, they need 3 different columns
Several tables for similar content
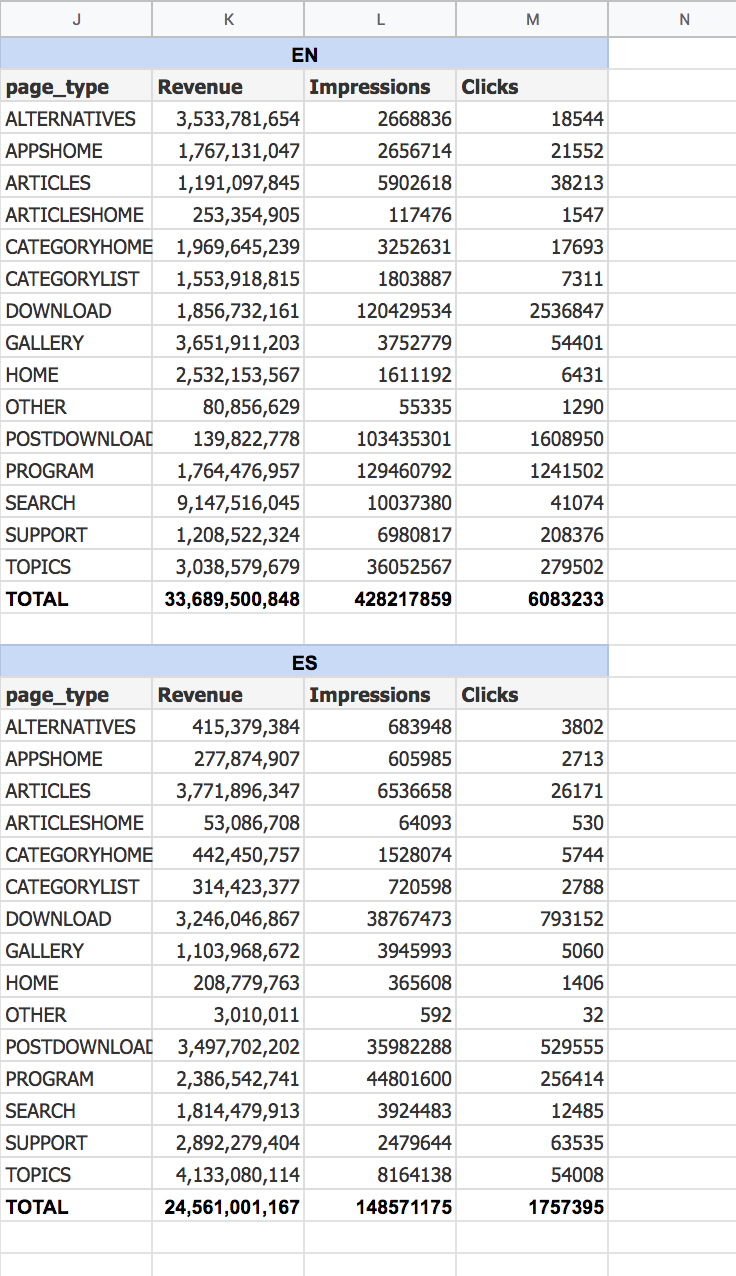
In a similar fashion as dividing content in tabs, dividing contents with similar dimensions in tables is a no no. It might be more intuitive because more readable for a human, but it makes crossing ES and EN complex operations.
Dimensions vs. Metrics
First let’s define two major concepts: Dimensions & Metrics
Dimensions = Attributes of your data
Example: Site, country, page type, date, …Metrics = Quantitative measurements
Example: Number of sessions, Pages/Session, Revenue, …
The golden rules of a clean dataset
- In general, all the dimensions and metrics that we might need in the future should appear in one table.
- Each dimension and each metric should have their own column => The table is called “flat”
- Datasets that deserve to be split in different tables are datasets that don’t share similar attributes (different dimensions and different metrics)
- In that case, as a general rule, set one sheet per table, and name your sheet properly
- Any column of a table should be filterable and sortable
- The data should be formatted correctly: numbers should be numbers, dates should be dates
At the end of the day, what counts is that the information should feel easy to manipulate